An instrumented version of the Neutrino microkernel (procnto-instr) is equipped with a sophisticated tracing and profiling mechanism that lets you monitor your system's execution in real time. The procnto-instr module works on both single-CPU and SMP systems.
The procnto-instr module uses very little overhead and gives exceptionally good performance -- it's typically about 98% as fast as the noninstrumented kernel. The additional amount of code (about 30K on an x86 system) in the instrumented kernel is a relatively small price to pay for the added power and flexibility of this useful tool. Depending on the footprint requirements of your final system, you may choose to use this special kernel as a development/prototyping tool or as the actual kernel in your final product.
The instrumented module is nonintrusive -- you don't have to modify a program's source code in order to monitor how that program interacts with the kernel. You can trace as many or as few interactions (e.g. kernel calls) as you want between the kernel and any running thread or process in your system. You can even monitor interrupts.
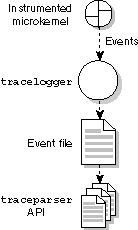
Here are the essential tasks involved in kernel instrumentation:

Instrumentation at a glance.
You control the process of emitting trace events by:
To collect and analyze the events in your system, you have these facilities at your disposal:
| Utility/function | Description |
|---|---|
| tracelogger | Command that logs trace events to a file. |
| TraceEvent() | Function that you use in your programs to control which events are emitted. |
| traceparser | Library that provides the API to parse the event file. |
| traceprinter | Command that uses that API to display the resulting trace events. |
In the following example, we'll use these basic instrumentation techniques:
At the system prompt, enter the tracelogger command:
tracelogger
When invoked without any options, the logger cycles through the default number of trace buffers (32) and then outputs the data collected to the default event file (/dev/shmem/tracebuffer).
By default, the logger also operates in fast emitting mode (i.e. it will log only the most important two kernel call arguments and two return values). For comprehensive logging, you can specify wide emitting mode, which tells the logger to capture all kernel call arguments and all return values for each call.
In order to interpret the data collected in the event file (tracebuffer), we'll run the traceprinter utility, which parses the event file and gives us a report of the events that were traced:
At the system prompt, enter:
traceprinter
On your screen you should now see output similar to the following:
TRACEPRINTER version 0.94
 -- HEADER FILE INFORMATION --
       TRACE_FILE_NAME:: /scratch/quadlog
            TRACE_DATE:: Fri Jun  8 13:14:40 2001
       TRACE_VER_MAJOR:: 0
       TRACE_VER_MINOR:: 96
   TRACE_LITTLE_ENDIAN:: TRUE
        TRACE_ENCODING:: 16 byte events
       TRACE_BOOT_DATE:: Fri Jun  8 04:31:05 2001
  TRACE_CYCLES_PER_SEC:: 400181900
         TRACE_CPU_NUM:: 4
         TRACE_SYSNAME:: QNX
        TRACE_NODENAME:: x86quad.gp.qa
     TRACE_SYS_RELEASE:: 6.1.0
     TRACE_SYS_VERSION:: 2001/06/04-14:07:56
         TRACE_MACHINE:: x86pc
     TRACE_SYSPAGE_LEN:: 2440
 -- KERNEL EVENTS --
t:0x1310da15 CPU:01 CONTROL :TIME msb:0x0000000f, lsb(offset):0x1310d81c
t:0x1310e89d CPU:01 PROCESS :PROCCREATE_NAME
                      ppid:0
                       pid:1
                      name:./procnto-smp-instr
t:0x1310eee4 CPU:00 THREAD  :THCREATE      pid:1 tid:1
t:0x1310f052 CPU:00 THREAD  :THRUNNING     pid:1 tid:1
t:0x1310f144 CPU:01 THREAD  :THCREATE      pid:1 tid:2
t:0x1310f201 CPU:01 THREAD  :THREADY       pid:1 tid:2
t:0x1310f32f CPU:02 THREAD  :THCREATE      pid:1 tid:3
t:0x1310f3ec CPU:02 THREAD  :THREADY       pid:1 tid:3
t:0x1310f52d CPU:03 THREAD  :THCREATE      pid:1 tid:4
t:0x1310f5ea CPU:03 THREAD  :THRUNNING     pid:1 tid:4
t:0x1310f731 CPU:02 THREAD  :THCREATE      pid:1 tid:5
and so on, for hundreds of lines! This is normal. When you run tracelogger without setting up any trace conditions, you'll likely end up with much more data than you'll ever need. As we'll see shortly, it's easy to control precisely which events you want to capture.
Here are the essential elements to note when looking at the output from traceprinter:
For more information, see the entry for traceprinter in the Utilities Reference.
Suppose in your output from traceprinter you had several lines showing "ring0" kernel calls, like this:
.
.
.
t:0x1b068634 CPU:01 KER_CALL:MSG_SENDVNC/12 coid:0x40000000 msg:"" (0x00000000)
t:0x1b068b61 CPU:01 THREAD  :THREPLY       pid:155665 tid:1
t:0x1b068d2a CPU:01 THREAD  :THRUNNING     pid:1 tid:9
t:0x1b069462 CPU:01 KER_EXIT:MSG_RECEIVEV/14 rcvid:0x0000000d rmsg:"" (0x00000000)
t:0x1b069938 CPU:02 KER_CALL:RING0/02 func_p:ff8210ba arg_p:e7feae0c
t:0x1b069c71 CPU:02 KER_EXIT:RING0/02 ret_val:0xe7aa5bd8 empty:0x00000000
t:0x1b069f3d CPU:02 KER_CALL:RING0/02 func_p:ff80e720 arg_p:e7feade8
t:0x1b06a290 CPU:02 KER_EXIT:RING0/02 ret_val:0x07ab0000 empty:0x00000000
.
.
.
We can write a very simple control program to filter-out those particular calls:
#include <sys/trace.h>

int main(int argc, char **argv)
{
    /* set fast emitting mode */
    (void) TraceEvent(_NTO_TRACE_SETALLCLASSESFAST);

    /* include all classes */
    (void) TraceEvent(_NTO_TRACE_ADDALLCLASSES);

    /* exclude all "ring0" kernel calls */
    (void) TraceEvent(_NTO_TRACE_DELEVENT, _NTO_TRACE_KERCALL, 2);

    /* start tracing */
    (void) TraceEvent(_NTO_TRACE_START);

    return (0);
}
When you run tracelogger in daemon mode, the logger will simply log the requested number of iterations and then terminate. Like a "manual override" function on an auto-focus camera, daemon mode gives us all the control we want.
First, we start the logger in daemon mode:
tracelogger -d
Then we can run our little control program. The output above, which showed several kernel calls, would now look like this:
.
.
.
t:0x1b068634 CPU:01 KER_CALL:MSG_SENDVNC/12 coid:0x40000000 msg:"" (0x00000000)
t:0x1b068b61 CPU:01 THREAD  :THREPLY       pid:155665 tid:1
t:0x1b068d2a CPU:01 THREAD  :THRUNNING     pid:1 tid:9
t:0x1b069462 CPU:01 KER_EXIT:MSG_RECEIVEV/14 rcvid:0x0000000d rmsg:"" (0x00000000)
.
.
.
We can apply this filtering method to include or exclude various classes of events (kernel calls, interrupts, thread states, etc.), as well as the many events within each class.
As we saw in our control program above, you use a single kernel call, TraceEvent(), in order to control and fine-tune the instrumentation process:
TraceEvent(mode [,class [,event]] [,P1 [,P2 [,P3 ... [,Pn]]]])
This function controls all stages of the instrumentation process, which include:
The TraceEvent() function's three main arguments (mode, class, and event) allow for an enormous range of control. You can manipulate as many as 32 classes; each class can contain 1024 events. For details, see the entry for TraceEvent() in the Library Reference.
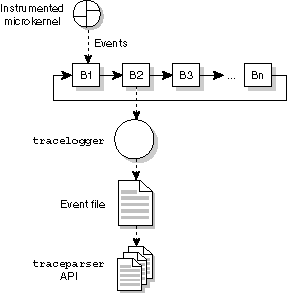
Events are emitted to the internal trace buffers, which are organized as a circular linked list:

Trace event buffers.
You can have as many buffers in your system as memory resources allow (the default is 32). Each buffer can hold 1024 events. When the high-water mark (around 80% capacity of the buffer) is reached, the buffer is closed and its location is passed to the tracelogger utility, which then stores the buffer's contents in an event file.
The fixed-size structure of trace events stored within every trace buffer consists of four fundamental data types defined as follows:
typedef struct traceevent {
  uint32_t  header;        // CPU number, flags, class, event
  uint32_t  timeoff;       // LSB 32-bit timeoff/data
  uint32_t  data[2];       // event data
} traceevent_t;
The traceevent_t structure's small size (16 bytes) helps eliminate instrumentation overhead and improves the granularity of a trace event stream by allowing precise modulation of its output.
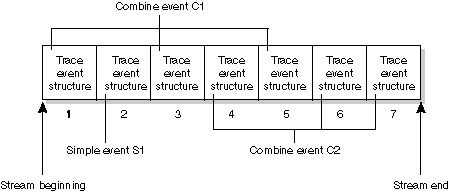
This modulation is achieved by a "thin" protocol composed of simple events that are grouped into more complex trace events called combine events.
The following diagram shows an event stream containing a total of seven traceevent_t structures that code one simple event and two combine events:

Stream with one simple event and two combine events.
The traceparser library provides the interface to the file where trace events are stored. The library contains all functions to open and to parse the trace event file. The parsing module within the library scans the event file linearly and deinterlaces the event stream; it also checks and assembles all combine events. You can use callback functions to access the resulting trace information presented in the form of buffers.
The declaration of the callback function is as follows:
int user_callback_fun(unsigned h, unsigned t, unsigned* p, unsigned l);
where:
The registered callback function is executed every time the particular trace event is encountered within the event file. Different event classes and events may be represented by event types with different lengths of the event data buffer.
The traceparser library includes the following interface functions and parameters:
| Function/global variable | Description |
|---|---|
| traceparser() | Main entry to the traceparser module. |
| traceparser_cs() | Set up a callback function for a single trace event. |
| traceparser_range_cs() | Set up callback functions for several trace events. |
| traceparser_verbose | A global variable to control the verbosity level of the parsing process. |
| traceparser_syspage_ptr | Pointer to the system page structure (syspage_entry). |
| traceparser_head_info[] | Array of pointers to strings from the trace event header file. |
| traceparser_head_info_size[] | Array of field lengths from the trace event header file. |
| traceparser_endian_conv | Equal to a nonzero value for endian conversion. |
The functions traceparser_cs() and traceparser_cs_r() let you attach callback functions to the registered (valid) trace events and event classes.
The following pseudo code shows how the traceparser library may be typically used:
int user_callback_fun_1(unsigned h, unsigned t, unsigned* p, unsigned l)
{
  ...
  return (...);
}

int user_callback_fun_2(unsigned h, unsigned t, unsigned* p, unsigned l)
{
  ...
  return (...);
}

int user_callback_fun_3(unsigned h, unsigned t, unsigned* p, unsigned l)
{
  ...
  return (...);
}
           .
           .
           .
int user_callback_fun_n(unsigned h, unsigned t, unsigned* p, unsigned l)
{
  ...
  return (...);
}

int user_callback_fun_r(unsigned h, unsigned t, unsigned* p, unsigned l)
{
  ...

  return (...);
}

int main(...)
{
  ...
  if ("user verbose") traceparser_verbose = 1;
  ...
  traceparser_cs(user_callback_fun_1, "user class a", "user event 1");
  traceparser_cs(user_callback_fun_2, "user class b", "user event 2");
  traceparser_cs(user_callback_fun_3, "user class c", "user event 3");
                                .
                                .
                                .
  traceparser_cs(user_callback_fun_n, "user class x", "user event n");
  ...
  traceparser_range_cs(user_callback_fun_r, "user class y", "user first event",
              "user event range");

  traceparser("user event filename");

  return (...);
}
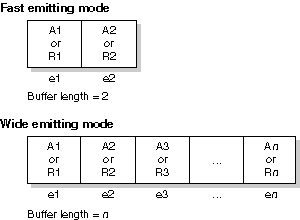
Kernel call arguments and return values are passed to your callback functions within an allocated buffer as shown here:

Structure for fast and wide modes.
In fast emitting mode, only two of the most important kernel call arguments and return values are intercepted and passed to callback functions.
In wide emitting mode, all kernel call arguments and return values are intercepted and passed.
The size of one single element en that typically holds one single kernel call argument or return value A|Rn is four bytes. In certain cases, an argument or return value A|Rn may span more than one single element en. All kernel call arguments and return values are packed linearly, one by one within the buffer.
For more information, see the entry for TraceEvent() in the Library Reference.